How Am I Lucky, a data visualization of luck
Interactive web app to visualize probability and luck statistics with React, D3.js and Framer Motion.
The project
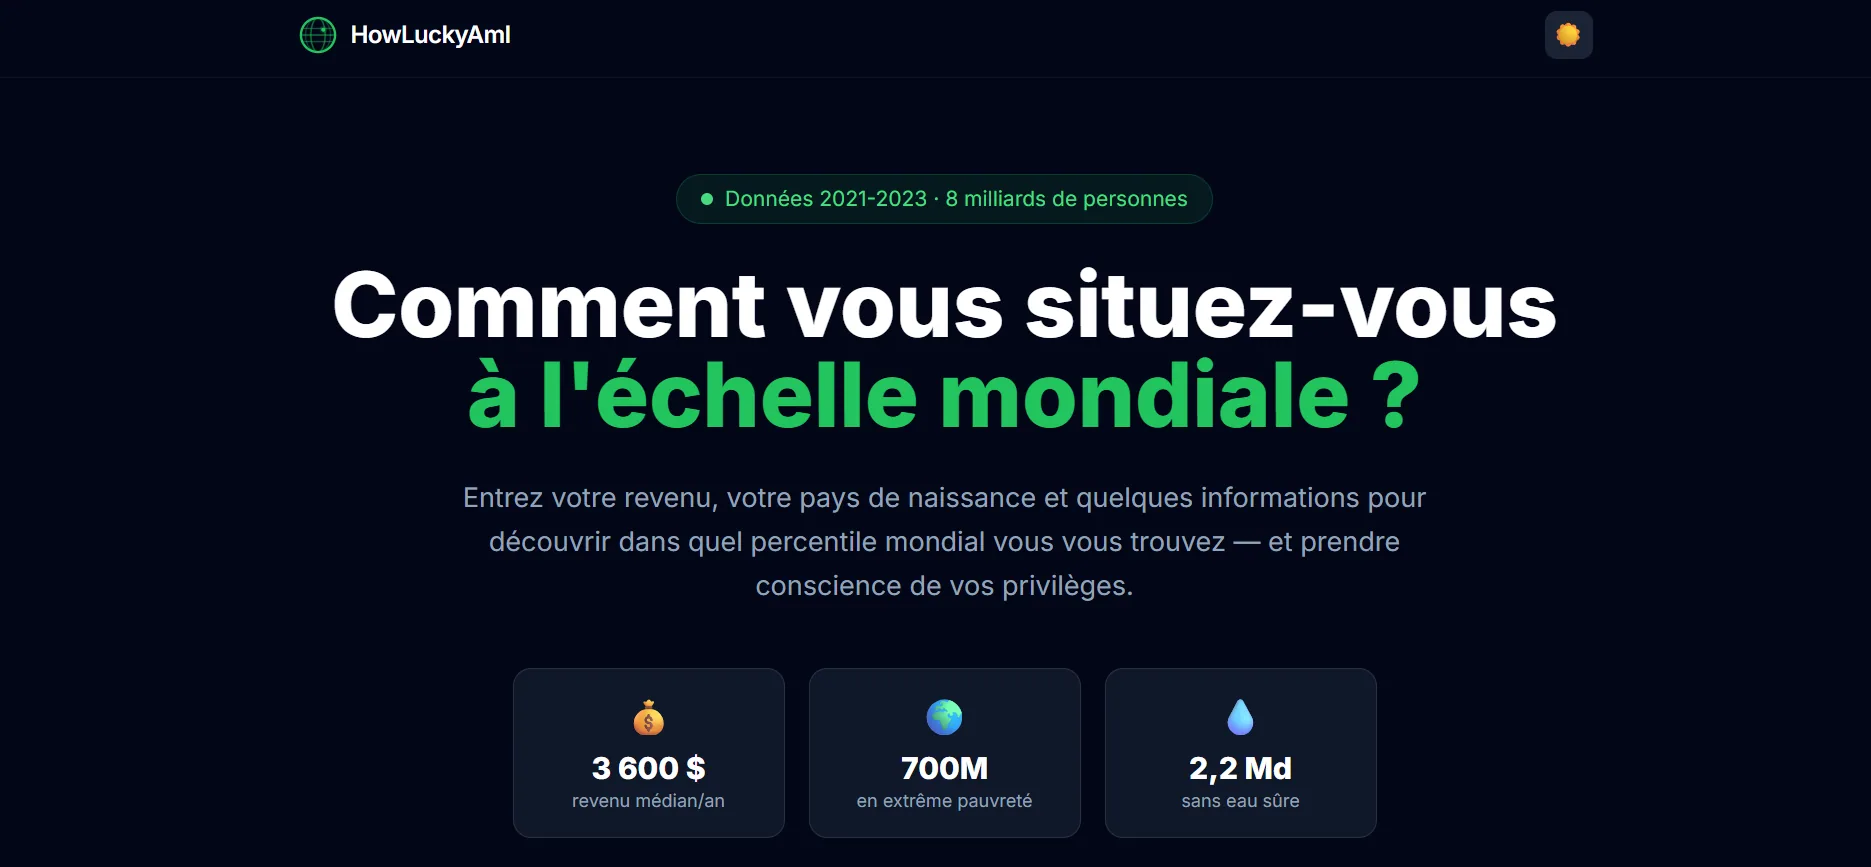
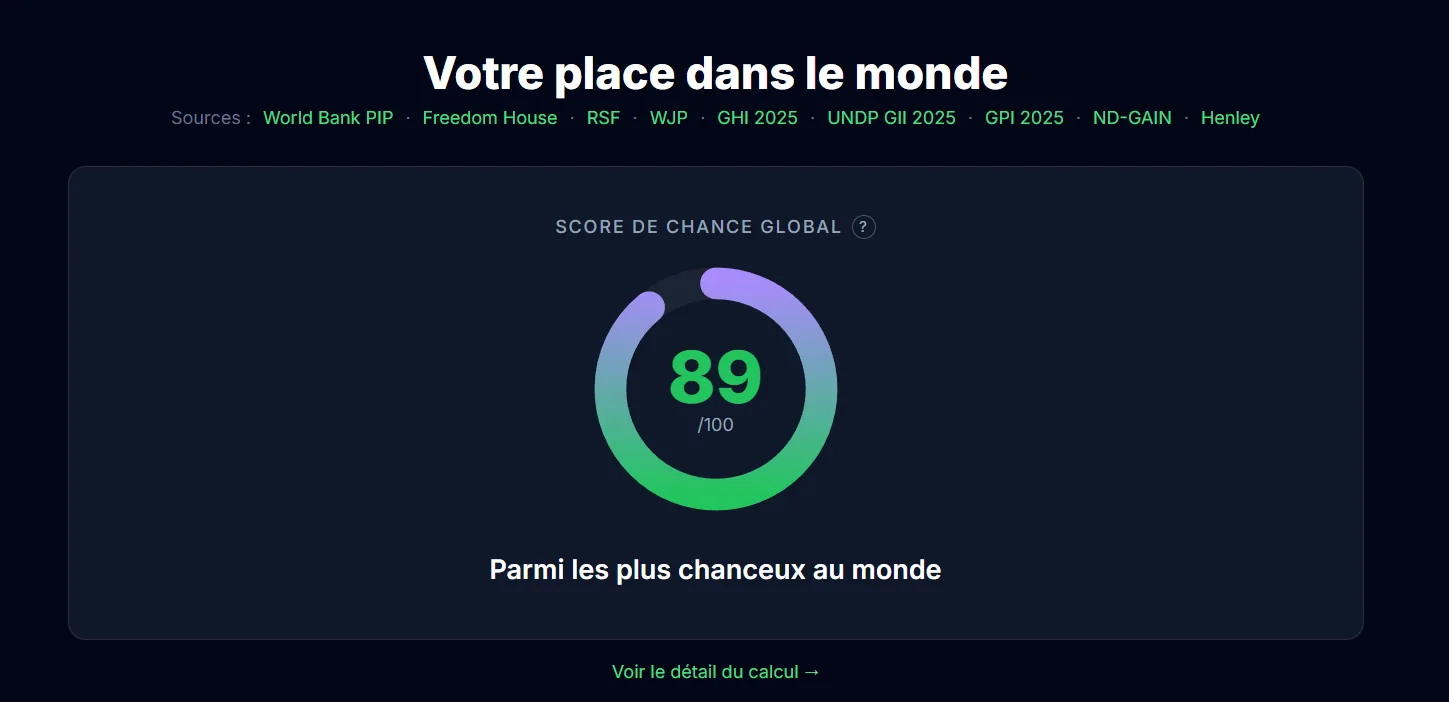
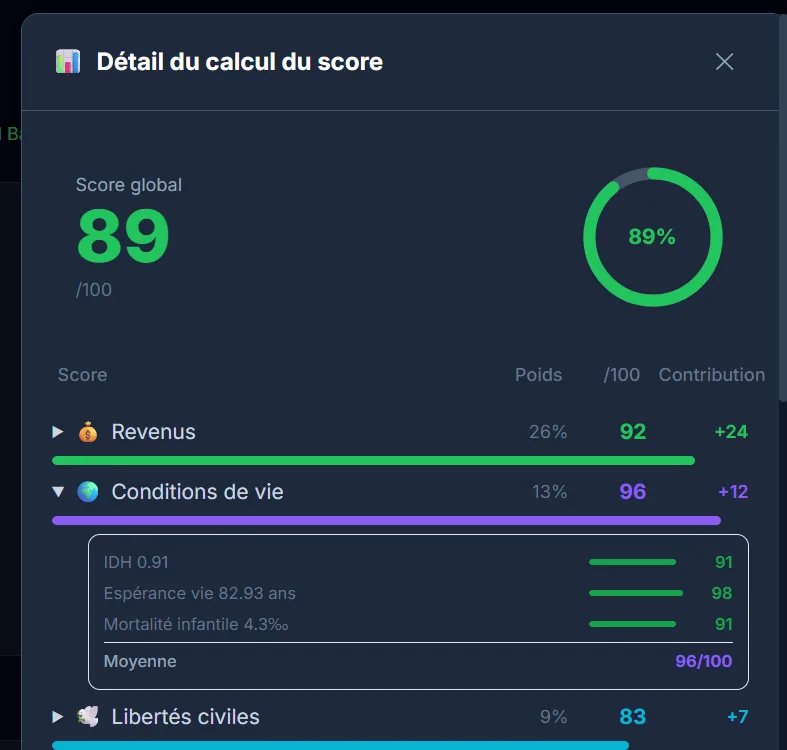
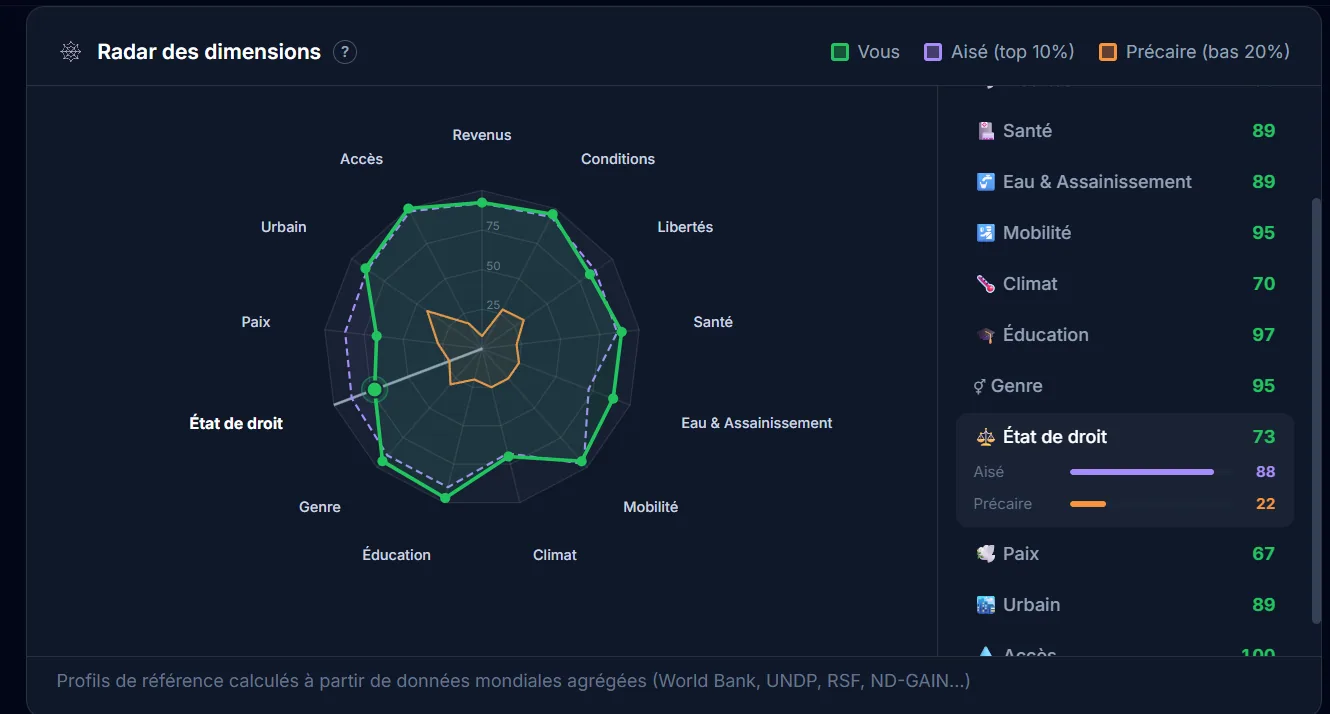
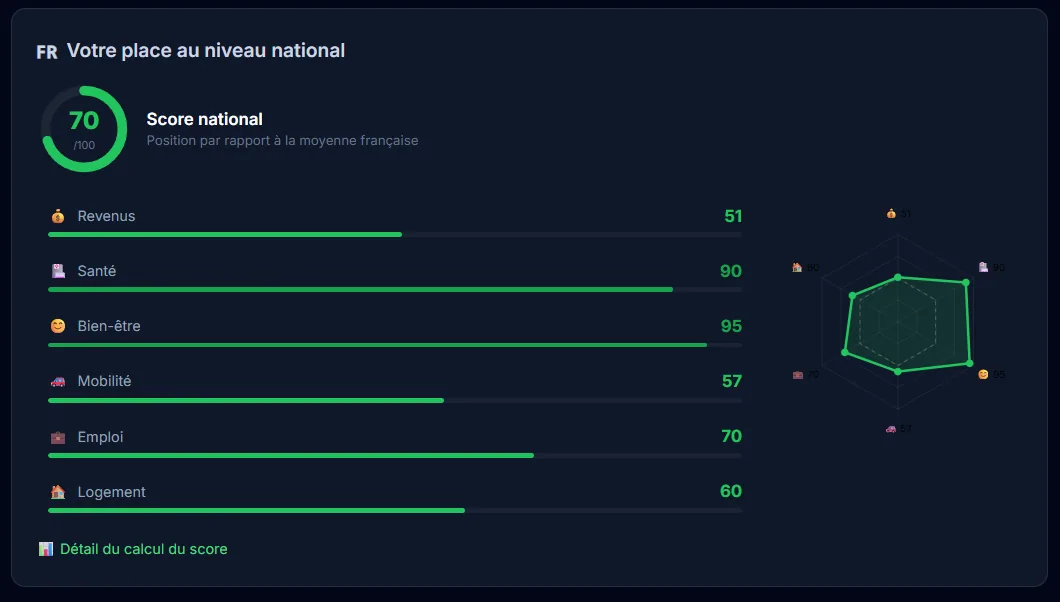
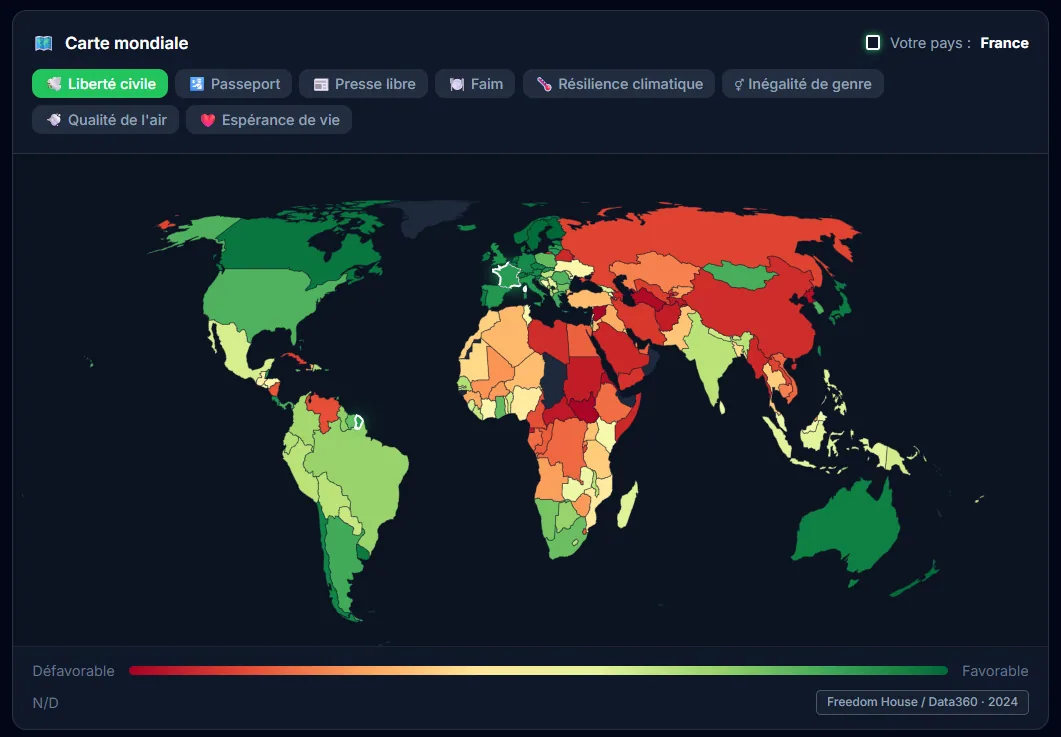
How Am I Lucky is a platform that lets you compare yourself on about fifty indicators to measure how “lucky” a person is. A kind of compass to see where you stand in the world, through interactive visualizations. There are obviously some methodological biases (especially the choice of indicators), but the result is pretty telling, especially to put things you take for granted back into perspective.
My contributions
Full build: React frontend with D3.js and Recharts visualizations, Framer Motion animations, Express backend, and a Python data pipeline feeding the ~50 indicators. Tests set up with Vitest. The idea was for the data part to evolve without rebuilding the front.
Takeaways
Making statistics speak visually and accessibly remains a real challenge. Combining D3.js and Recharts gives very complementary results: D3 for bespoke stuff, Recharts for standard charts without wasting time. Splitting the Python data pipeline and the React frontend works really well, especially when you don’t want to regenerate data every time.
Context
Personal project. The idea was to make an abstract concept, luck, tangible through concrete data and interactive visualizations. An exercise that obviously has its limits, but works pretty well as a thinking trigger.
App preview
Tech stack
-
React 18 / Vite
-
D3.js / Recharts
-
Framer Motion
-
Express.js
-
Tailwind CSS
-
Python
-
Vitest / Testing Library
Cover image generated by Nano Banana (Google), since I no longer have the mockup template I used before. So it’s not a screenshot of the actual tool.